Underwrite Decisions
See further. Think faster. Decide with confidence.
Gain deeper insights and conduct meaningful risk assessments so that you can reach see what others miss.
Trusted by owners and asset managers, lenders and insurers, and investors and diligence teams.
Cut through uncertainty. Redefine your future.
01
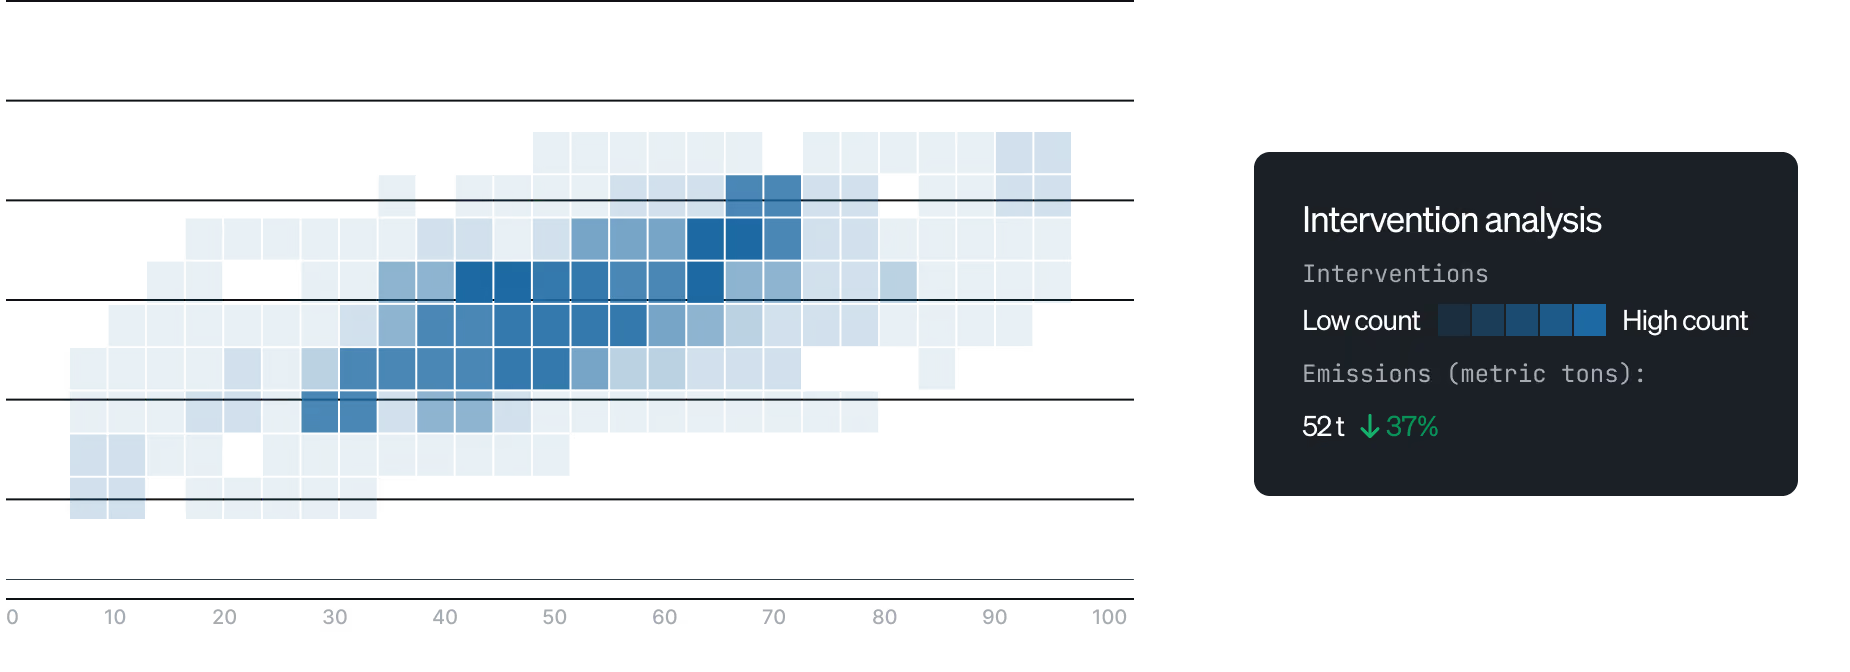
Expand your set of choices
Screen transactions for energy performance and compliance exposure before you commit.
02
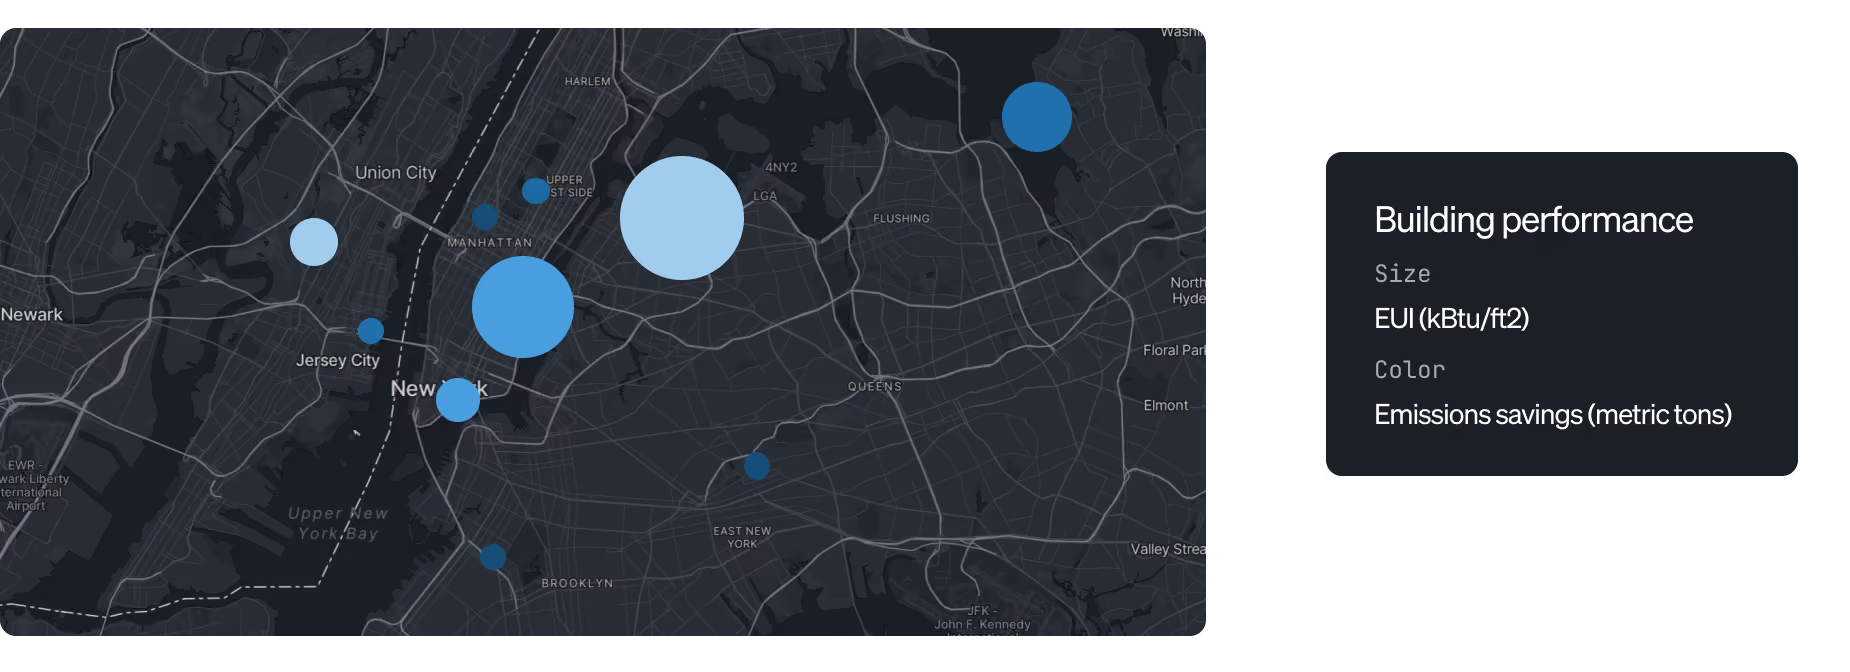
Quantify risk at every step
Surface and size risk to support better decisions.
03
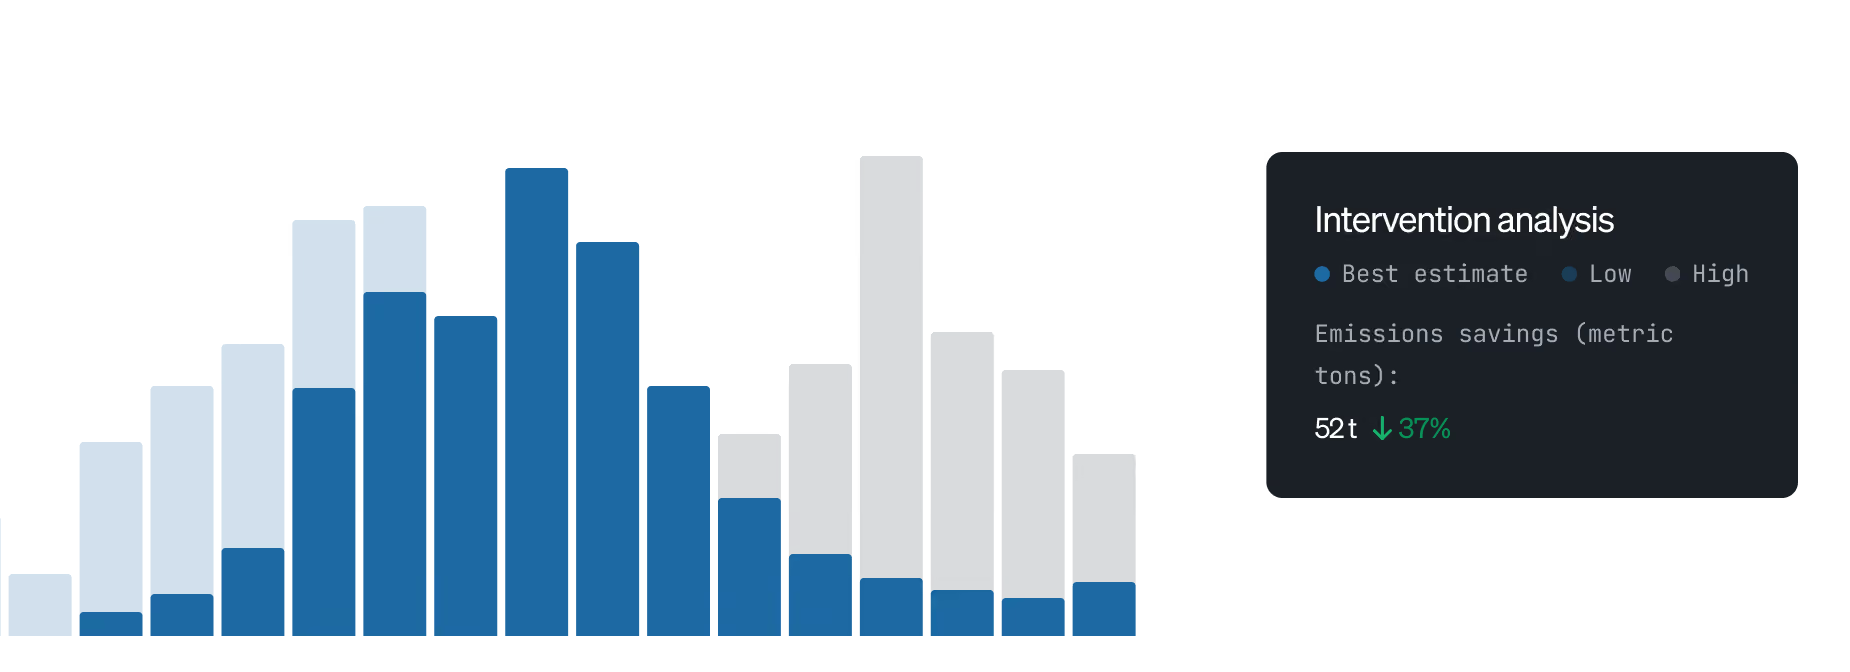
Verify the numbers you rely on
Make better use of the information you already have, reduce false precision, and help teams deploy capital with greater confidence.
Explore other possibilities of Carbon Signal
Understand Baselines
Bespoke benchmarks for even the most complex, unique buildings — inferred from existing energy data.
Understand Baselines
Uncover Pathways
Shared language to communicate and drive alignment on intervention roadmaps.
Uncover Pathways

What stands out about their platform for me is the remarkable accuracy of their models and their ability to recalibrate to real-world situations with high fidelity.
— Workspace